Four amazing ways to experience data - Specialmoves

Four amazing ways
to experience data
Digital Sizzle 6
The result? Four working interactive experiences, based on their own unique creative interpretations and technical approaches.
All made possible by #Sizzle6 hackathon, its organisers @3_beards, tech donors HP, Twilio and Brandwatch, and plenty of coffee.


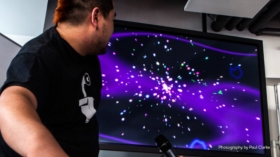
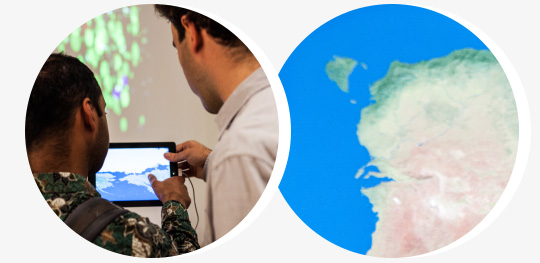
See-thru planet - Pascal
A simple idea, but very powerful – like all the best ideas are – and winner of the overall Digital Sizzle top prize.
The iPad app Pascal made reminds us we are living on the surface of a giant sphere. By holding your iPad over the ground, you can see what's on the opposite side of the world.
Tech used: Unity3D
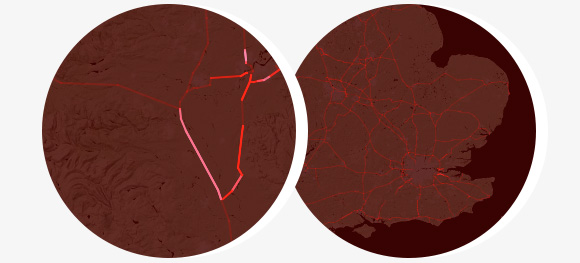
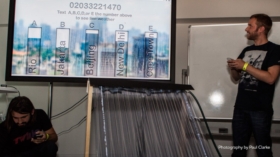
Arteries of Great Britain – Pascal
Perhaps the interpretation of the four closest to "conventional", Arteries of Great Britain is a beautiful, hypnotic take on data visualisation. It draws on the unpromising-sounding source of traffic data from the UK's strategic road network during February 2012, and shows the traffic flow as if it were blood flowing through arteries in the human body.
Tech used: HTML, Javascript, Google Maps API
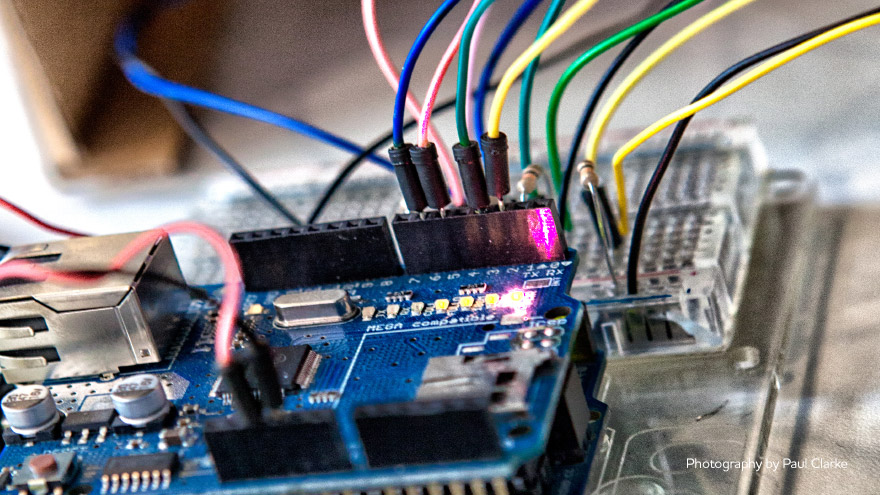
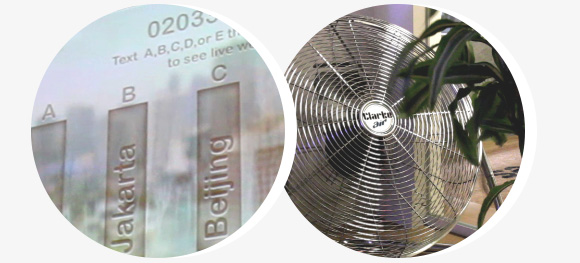
Real Weather – Gavin & Rik
It's hard to imagine what it feels like to be in hot and sunny Rio when you're sitting in a grey, rainy London. But this experience aims to do just that – by bringing the actual weather in your choice of different world cities to you through physical, visual and aural stimuli. Ten days of real weather is delivered in just 100 seconds with the help of water, a high powered fan, a strong lamp, and a "lightning" strobe light- accompanied by music, sound effects and video.
Tech used: Adobe Flash, .NET Gadgeteer, Node JS, Twilio API, Weather Underground API
With thanks to Tom Berman, Tom Evans, Ruban Khalid and Drew Schweppe.
For more details on how the team made Real Weather, visit Rik's blog.
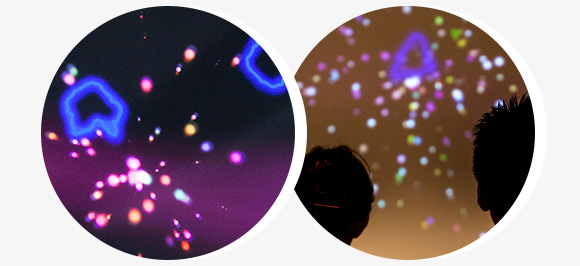
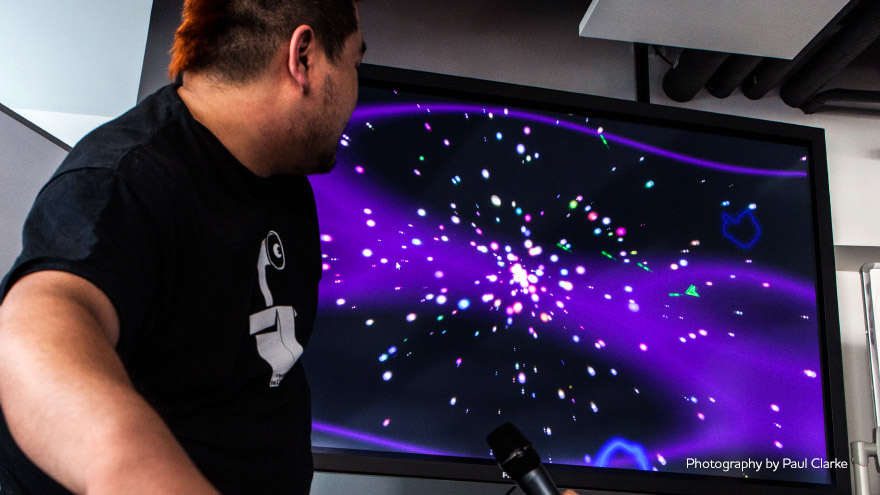
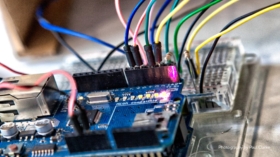
Project Nadleeh – Stephen
Given Stephen's passions for gaming and tweeting, it wasn't a surprise that his approach to data visualisation would combine the two. His experience was a game that at first appears to be a single user experience, but actually the difficulty is based on Brandwatch data of Arsenal & Man Utd. fan reactions on social media and soon becomes influenced by live emotions and interventions of Twitter users out in the wider world…
Tech used: Flash Adobe Air, Starling, Stage3D, Arduino.